
Most “free Airbnb spreadsheet templates” are a long-term rental log with the word Airbnb in the title. They track one rent figure a month — which is exactly the number a short-term rental doesn’t have. A real STR spreadsheet has to model nightly rate, occupancy, and the costs that scale per night and per booking, then report the four KPIs every host benchmarks against: occupancy, ADR (average daily rate), RevPAR (revenue per available night), and break-even occupancy.
Airbnb / STR preselected · 21 countries · free Excel export
What makes an STR spreadsheet different
A buy-to-let spreadsheet assumes a fixed monthly rent and a flat vacancy percentage. A short-term rental breaks both assumptions:
- Revenue is nightly rate × occupied nights, not a lease. Two months at the same occupancy can earn very different amounts if your nightly rate moved with the season.
- Some costs are per night. Tourism and occupancy levies are charged on each night booked.
- Some costs are per booking. Cleaning is paid once per stay — so ten one-night bookings cost ten cleans, while one ten-night booking costs one.
- Platform fees are a percentage of revenue, so they only make sense once revenue is modelled correctly.
A generic income log that only has a “rent received” column can’t see any of this. If your cleaning bill looks high, you can’t tell whether it’s a price problem or just a lot of short stays — because the number of bookings was never recorded. A proper STR template tracks nights booked and number of bookings as separate columns, so every cost that scales with them calculates from your actual usage instead of a flat guess.
The STR metrics it tracks
The four numbers hosts actually compare are all on the Summary sheet for Airbnb properties:
| Metric | What it means | Formula |
|---|---|---|
| Occupancy | Share of available nights that were booked | Nights booked ÷ nights available |
| ADR | Average daily rate — what you earn per booked night | Room revenue ÷ nights booked |
| RevPAR | Revenue per available night — blends rate and occupancy | ADR × occupancy (or revenue ÷ nights available) |
| Break-even occupancy | The fill rate you need just to cover costs | Annual costs ÷ (ADR × nights available) |
RevPAR is the one that matters most, because it catches the trade-off ADR and occupancy hide on their own. High occupancy at a low rate and low occupancy at a high rate can produce the same RevPAR — and RevPAR is what tells you which pricing strategy actually earned more. Break-even occupancy is the reality check: if you need 70% occupancy to cover costs and your market runs at 55%, the deal doesn’t work no matter how good the photos are.
These are computed for you — you don’t build the formulas. (If you’ve only ever searched for a “short term rental spreadsheet” and found generic income logs, this is the difference.)
What’s in the template
The export is an 8-sheet Excel workbook (it opens in Excel, Google Sheets, or LibreOffice). For an Airbnb property the STR-specific behaviour shows up across several sheets:
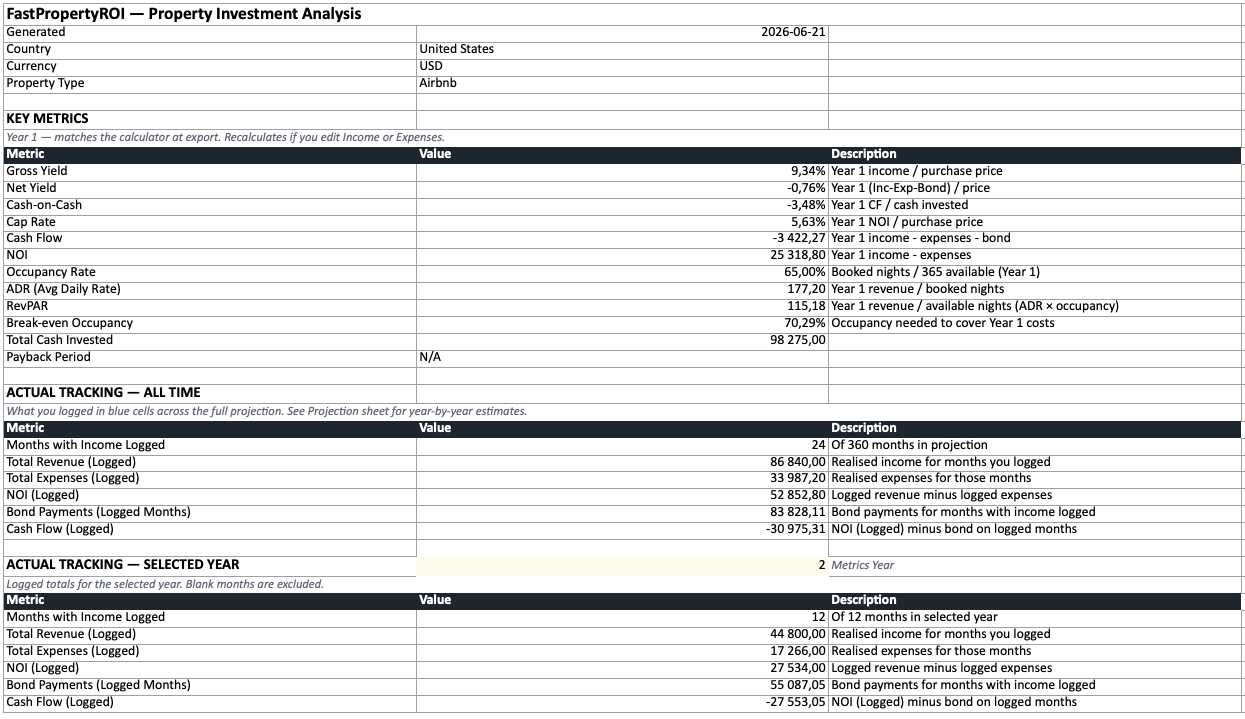
- Summary — gross yield, net yield, cash-on-cash, cap rate and payback period as live formulas, plus the STR KPIs: occupancy, ADR, RevPAR, and break-even occupancy.
- Purchase Costs — every closing cost for your country (transfer tax, legal, registration, deposit), all editable.
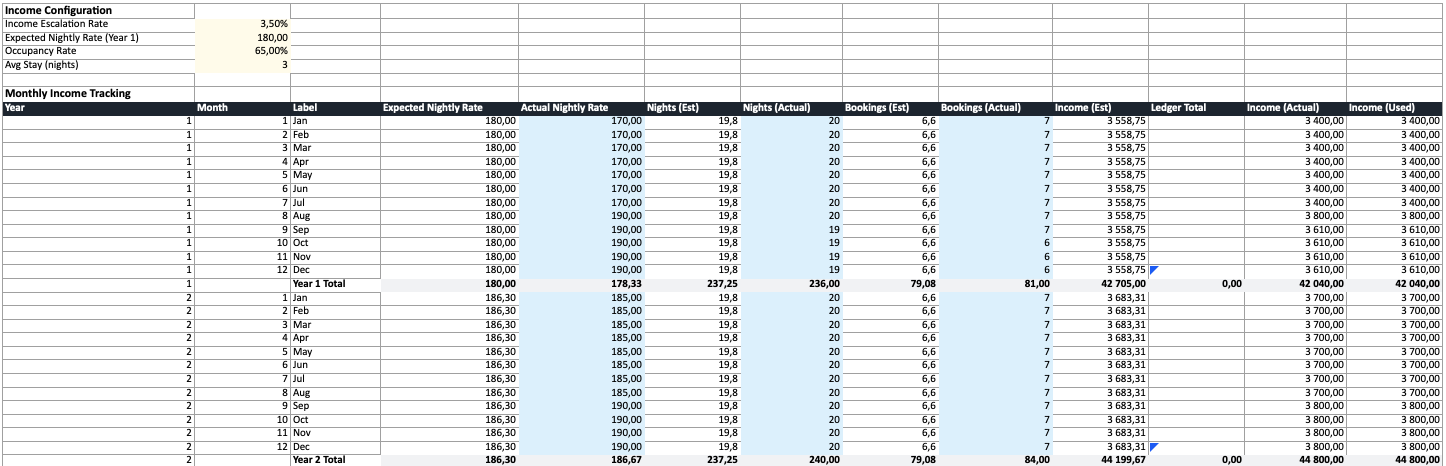
- Income — config at the top (nightly rate, occupancy, average stay length), then a monthly tracking table with nightly rate, nights booked, and bookings columns alongside estimated and actual revenue.
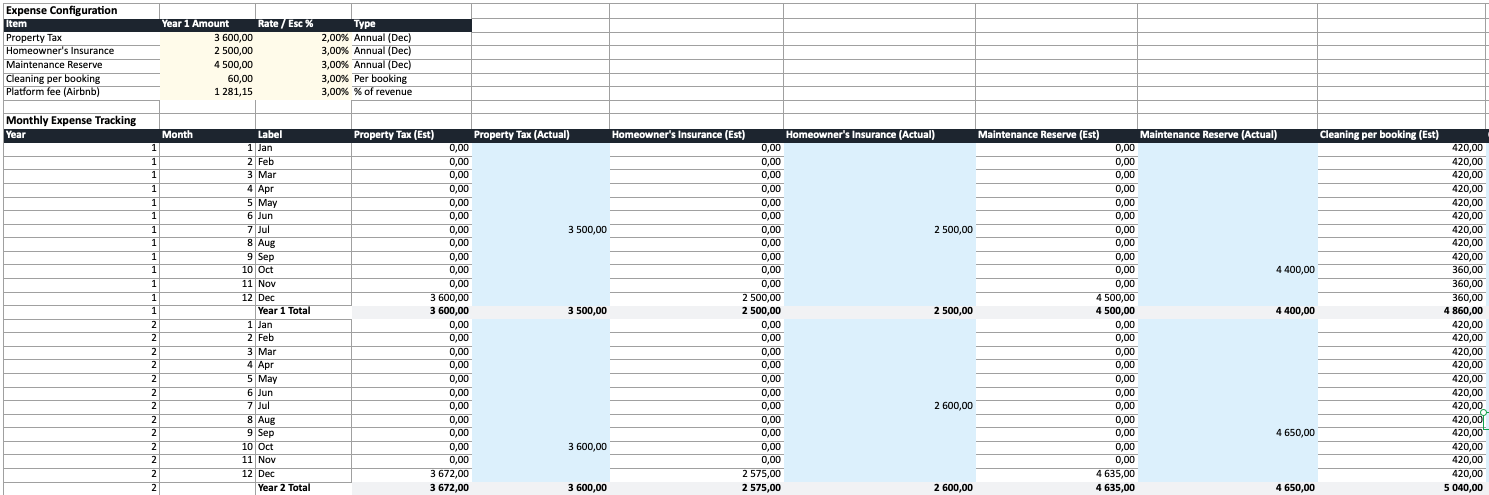
- Expenses — each cost on its own row with its own escalation rate. Per-night costs (tourism levies) and per-booking costs (cleaning) calculate from the nights and bookings you log, and revenue-linked costs (platform fees) reference the Income sheet.
- Bond — a full monthly mortgage amortization schedule where you can log extra principal payments.
- Projection — multi-year and fully formula-driven, blending your logged actuals with estimates for months you haven’t filled in yet.
- Exit Scenario — sale value, exit costs, capital gains tax and net proceeds if sold.
- Notes — the colour code (yellow = editable, blue = actuals) and how each sheet connects.
For the field-by-field breakdown that applies to every property type, see what’s inside the free exported spreadsheet, or the best free rental property spreadsheet templates for 2026 for how it compares to blank templates and property-management software.
Worked example
Say you’re modelling a property that lets at $180 a night at 65% occupancy:
- ADR is $180 — the average rate across booked nights.
- Occupancy is 65%, so you book about 237 of 365 available nights (365 × 0.65).
- RevPAR is ADR × occupancy = $180 × 0.65 = $117.
- Annual room revenue is roughly 237 × $180 = $42,705.
Now the costs that a long-term template would miss. With an average stay of 3 nights, 237 booked nights is about 79 bookings — so at a $60 clean, cleaning runs roughly $4,740 a year (79 × $60), not a flat monthly figure. A $4-per-night occupancy levy adds about $948 (237 × $4). Platform fees at 3% take about $1,281 of revenue. None of those track correctly unless nights and bookings are recorded — which is the whole point of the per-night and per-booking columns.
The spreadsheet does this arithmetic with live formulas, so when you log actual nights and bookings each month, ADR, RevPAR, occupancy, and every per-night/per-booking cost recalculate against your plan.
How to get it
- Open the short-term rental calculator and pick your country, or go straight to the spreadsheet generator — both auto-detect where you are.
- Choose the Airbnb / short-term rental property type and enter your details: purchase price, nightly rate, occupancy, expenses, financing.
- Click Calculate to run the analysis.
- Click Export to Excel in the results.
It downloads instantly. No signup, no email. The numbers come from a real calculation using your country’s actual tax and fee structure — so you start from an accurate baseline instead of a blank grid. Prefer to weigh up a tool versus a DIY grid first? Read calculator vs spreadsheet.
Track bookings against your plan
A spreadsheet only earns its keep if you use it after you buy. The STR routine is short:
- Before purchase: export the deal, review every cost, and adjust any line where you have a firmer quote (a specific cleaning rate, your real platform fee).
- Monthly: spend five minutes logging actual nights booked, bookings, and revenue in the blue cells. Occupancy, ADR, and RevPAR on the Summary update automatically — you don’t need to fill in every month for it to work.
- Annually: compare estimated vs actual on the Projection sheet. If your real occupancy keeps landing below your estimate, update it and your future years self-correct.
That estimated-vs-actual comparison is the entire reason to track — see how to track Airbnb income and expenses for the full STR routine, or how to track rental property income and expenses for the long-term-let version.
Get your pre-filled STR template
Run your Airbnb through the calculator and export the workbook — accurate, country-specific, and free. Then make it yours: edit any assumption and log your bookings as they come in.