
Most “free rental property spreadsheet templates” are an empty grid with a few headings. You still spend an hour writing formulas, researching your country’s transfer tax and closing costs, and guessing whether your expense assumptions are even realistic — which is exactly the work a good template should have done for you.
Pre-filled from your numbers · 8 sheets · no signup or email
What makes a spreadsheet good
Before comparing options, it helps to know what separates a spreadsheet you’ll actually keep using from one you abandon after a month. The good ones share five things:
- Pre-populated, not blank. Real purchase costs and country-specific taxes already filled in, so you’re editing numbers rather than building from scratch.
- Estimated vs actual. A column for what you projected and a column for what really happened — that gap is the whole point of tracking.
- Per-item expense detail. Insurance, maintenance, management and rates each tracked separately with their own escalation rate, not lumped into one inflation figure.
- Live formulas that connect. Change one input and yields, cash flow and the projection all recalculate. Isolated sheets that don’t reference each other are just data entry.
- No signup wall. A genuinely free template downloads instantly — no email gate, no trial.
Most free templates hit one or two of these. Almost none hit all five.
The options in 2026
| Option | Pre-filled? | Country taxes | Actual tracking | Cost |
|---|---|---|---|---|
| Blank Excel/Google Sheets template | No | You research them | If you build it | Free |
| Paid templates (Etsy, Gumroad) | No | Rarely | Sometimes | $10–40 |
| Property management software (Stessa, Landlord Studio, Baselane) | n/a | n/a | Strong (bank sync) | Free–$$ |
| FastPropertyROI export | Yes | Built in (21 countries) | Yes (est vs actual) | Free, no signup |
A few honest notes:
- Blank templates are fine if you enjoy building spreadsheets and already know your local tax rates. Most people overestimate how much they’ll maintain a grid they had to assemble themselves.
- Paid templates are often well-designed, but you’re paying for formatting — and they still don’t know your country’s transfer-tax brackets or your actual deal.
- Property management software is excellent for day-to-day logging with bank-account sync and receipt scanning. What most of it doesn’t do is compare performance against your original investment projection — the “is this property doing what I expected?” question. A practical setup is to use PM software for daily logging and a projection spreadsheet for the yearly reality check. (More on that in how to track rental property income and expenses.)
What’s in the free template
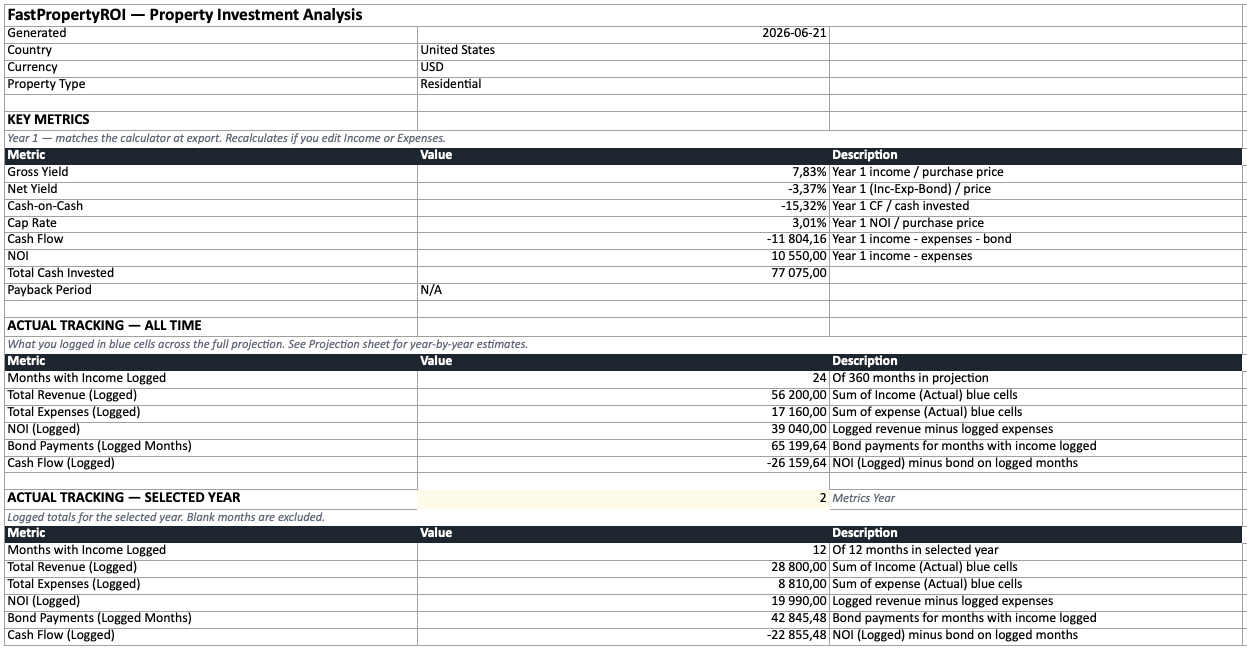
The FastPropertyROI export is an 8-sheet Excel workbook (it opens in Excel, Google Sheets, or LibreOffice). Each sheet has a role — some are editable inputs, some are for logging actuals, and one is entirely formula-driven:
- Summary — gross yield, net yield, cash-on-cash, cap rate and payback period as live formulas, plus all-time and per-year totals of what you’ve logged.
- Purchase Costs — every closing cost for your country (transfer tax, legal, registration, deposit), all editable.
- Income — config at the top (rent, escalation, vacancy), then a monthly tracking table with estimated, actual and “used” columns.
- Expenses — each cost on its own row with its own escalation rate, then per-category monthly tracking (estimated vs actual).
- Bond — a full monthly mortgage amortization schedule where you can log extra principal payments and see the effect.
- Projection — multi-year, fully formula-driven, blending your logged actuals with estimates for months you haven’t filled in yet.
- Exit Scenario — sale value, exit costs, capital gains tax and net proceeds if sold.
- Notes — the colour code (yellow = editable, blue = actuals) and how each sheet connects.
For the full field-by-field breakdown, see what’s inside the free exported spreadsheet.
Long-term vs short-term rentals
The template adapts to how you let the property:
- Long-term rentals track monthly rent received against your projected income, with vacancy built into the estimate.
- Short-term / Airbnb rentals get extra columns — nightly rate, nights booked, and number of bookings — so per-night costs (tourism levies) and per-booking costs (cleaning) calculate from your actual occupancy, not a flat guess. The Summary also reports the metrics every host benchmarks against — occupancy, ADR (average daily rate), RevPAR (revenue per available night), and break-even occupancy. If you’ve searched for a “short term rental spreadsheet” and found only generic income logs, this is the difference: the standard STR KPIs are built in and the costs that scale with nights and bookings are modelled correctly.
How to get it
- Open the spreadsheet generator — it auto-detects your country.
- Enter your property details: purchase price, rent, expenses, financing.
- Click Calculate to run the analysis.
- Click Export to Excel in the results.
It downloads instantly. No signup, no email. The numbers come from a real calculation using your country’s actual tax and fee structure — so you start from an accurate baseline instead of a blank grid. Prefer to model the deal first? Run it in the full ROI calculator and export from there.
Track actuals against your plan
A spreadsheet only earns its keep if you use it after you buy. The workflow that works:
- Before purchase: export the deal, review every cost, and adjust any line where you have a firmer quote.
- Monthly: spend five minutes logging actual rent and expenses in the blue cells. The projection’s actual columns update automatically — you don’t need to fill in every month for it to work.
- Annually: compare estimated vs actual on the Projection sheet. If a category is consistently off, update its escalation rate and your future years self-correct.
That estimated-vs-actual comparison is the entire reason to track — see how to track rental property income and expenses for the full routine, the rental income and expense spreadsheet columns that matter, or calculator vs spreadsheet if you’re deciding how to analyse the deal in the first place.
Get your pre-filled template
Run your property through the calculator and export the workbook — accurate, country-specific, and free. Then make it yours: edit any assumption and log your actuals as they come in.