Why tracking matters
Most property investors do detailed analysis before buying — they run the numbers, check the yield, project the cash flow. Then they buy the property and stop measuring.
This is a mistake. The assumptions you made before buying (rental income, vacancy, expense escalation, appreciation) are guesses. Educated guesses, but guesses. Some will be right. Some won’t. If you’re not tracking actuals against your original projections, you won’t know which assumptions were wrong until it’s too late to adjust.
Tracking isn’t about bookkeeping for its own sake. It’s about answering one question every year: is this property performing as expected?
What to track
Income
For long-term rentals, track your monthly rent received. Log the gross amount before any management fee deductions. Note any months with vacancy or partial rent — these are the data points that tell you whether your vacancy assumption was right.
For short-term rentals (Airbnb, holiday lets), track three things per month:
- Nights booked — your actual occupancy
- Number of bookings — separate stays, not just total nights
- Revenue — total received after or before platform fees (be consistent)
Nights and bookings matter because several costs are driven by them. Cleaning is per booking, tourism levies are per night, and platform fees are a percentage of revenue. If you only track revenue, you can’t see whether your costs are in line.
Expenses
Track every recurring cost as it occurs, broken out by category:
| Category | What to log | Typical frequency |
|---|---|---|
| Property tax / rates | Amount paid | Monthly or annual |
| Insurance | Premium | Annual |
| Maintenance | Each repair or service | As they happen |
| Management fees | Monthly fee | Monthly |
| Body corporate / HOA | Levy amount | Monthly or quarterly |
| Compliance | Certificates, inspections | Annual or as required |
| Utilities (if owner-paid) | Actual bills | Monthly |
Track each category separately. A monthly total doesn’t tell you whether it’s your insurance that’s escalating faster than expected or your maintenance costs. You need per-category visibility to act on it.
Property value
Check your property’s estimated market value once a year. You don’t need a formal valuation — comparable sales in your area give a reasonable estimate. This feeds into your equity position and your effective return if sold.
How often to update
Monthly is the right cadence for income and expenses. You’re already receiving rent and paying costs monthly — just log them as they happen. Setting aside 10 minutes at the end of each month is enough.
Annually, review the bigger picture:
- How did actual income compare to projected?
- Are expenses escalating faster or slower than you assumed?
- Has the property value moved?
- Is the gap between estimated and actual widening or narrowing?
Estimated vs actual
The most useful comparison isn’t “how much did I spend?” — it’s “how much did I spend vs what I expected?”
When you first analyse a property, your calculator or spreadsheet produces estimated annual income and expenses based on assumptions: rent escalates at 5%, insurance escalates at 3%, vacancy is 5%. Those assumptions define your projected cash flow and yield.
Tracking actuals lets you see the gap:
| Year 1 Est | Year 1 Actual | Variance | |
|---|---|---|---|
| Income | $30,000 | $28,500 | -$1,500 (higher vacancy) |
| Insurance | $2,500 | $2,800 | +$300 (rate increase) |
| Maintenance | $4,000 | $6,200 | +$2,200 (unexpected repair) |
| Management | $2,400 | $2,400 | $0 |
| Net cash flow | $5,500 | $1,500 | -$4,000 |
That $4,000 gap is invisible if you’re only tracking totals. Breaking it down by category tells you exactly what went wrong and whether it’s structural (ongoing higher costs) or one-off (a single repair that won’t recur).
What to do with the data
Income below projections
Is it a vacancy problem or a rate problem? If vacancy is higher than expected, revisit your marketing, pricing, or property condition. If you’re fully occupied but at lower rent, the market rate may be different from what you assumed.
For Airbnb properties, check your occupancy and ADR (average daily rate) separately. High occupancy at a low rate might mean you’re underpriced. Low occupancy at a high rate might mean the opposite. RevPAR (revenue per available night) combines both into one number for comparing periods, and break-even occupancy tells you the fill rate you need just to cover costs — all reported on the Summary sheet of the exported workbook.
Expenses above projections
Which category is the problem?
- Maintenance spikes in older properties are common and may signal deferred capital expenditure. Budget higher going forward or consider a major refurbishment.
- Insurance increases may justify shopping for a new provider or adjusting your excess.
- Management fee creep is worth negotiating, especially if your manager handles multiple properties.
- Property tax increases are usually outside your control but should be reflected in your future projections.
Both tracking well
Your original analysis was sound. Consider whether your escalation assumptions still hold for future years, and whether the property’s appreciation matches your exit scenario.
Tools for tracking
Spreadsheet
A spreadsheet gives you full control and flexibility. Our spreadsheet generator exports a ready-made Excel workbook designed specifically for ongoing tracking (see how it compares in the best free rental property spreadsheet templates for 2026):
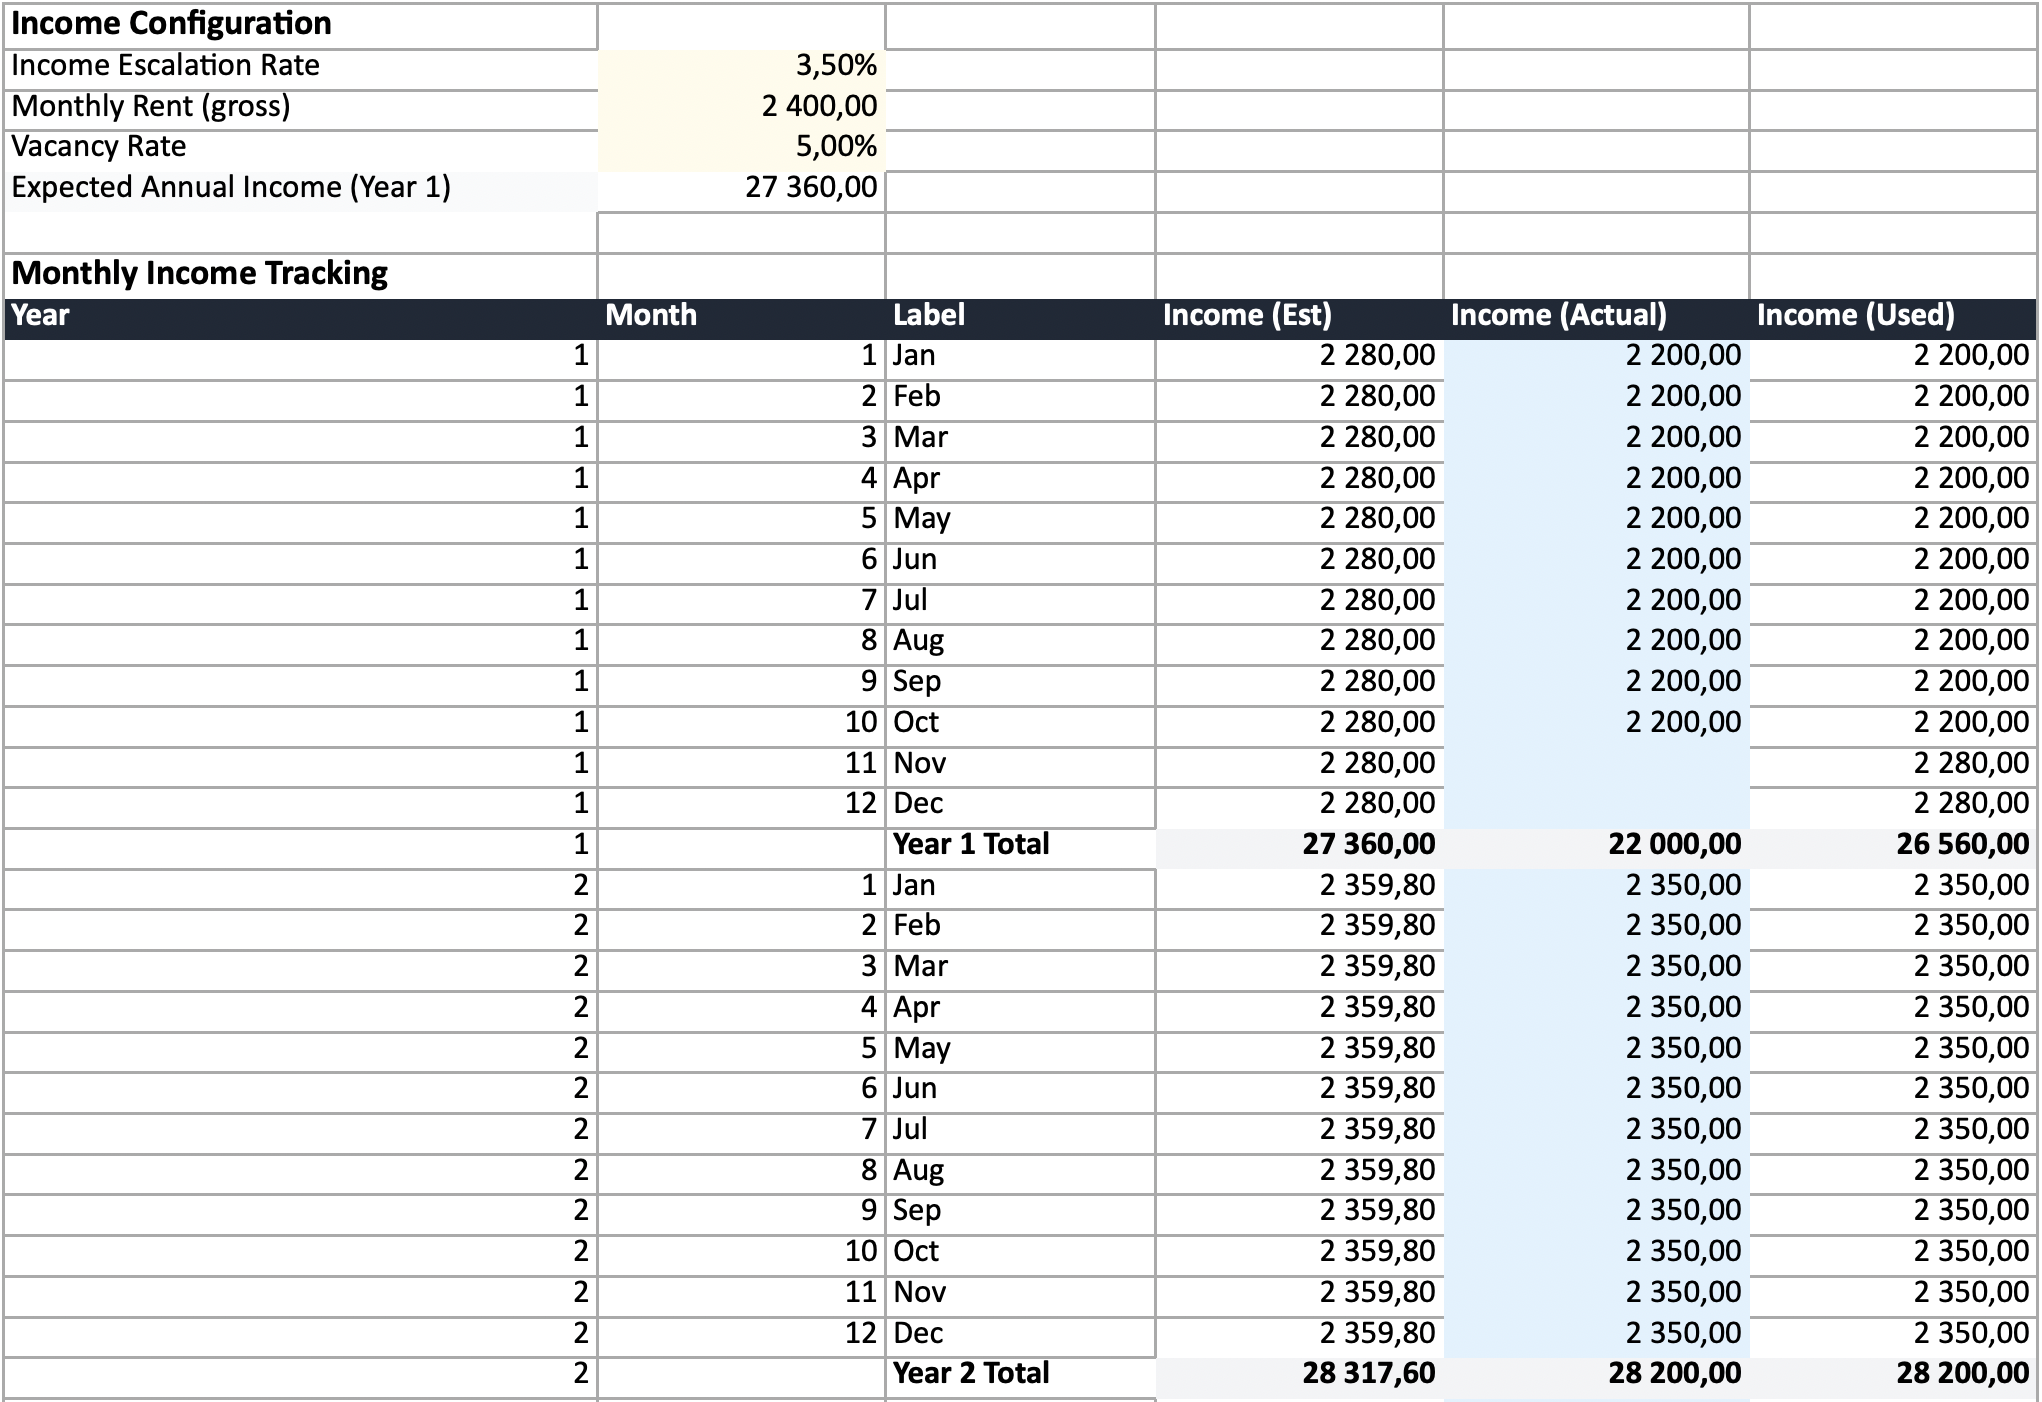
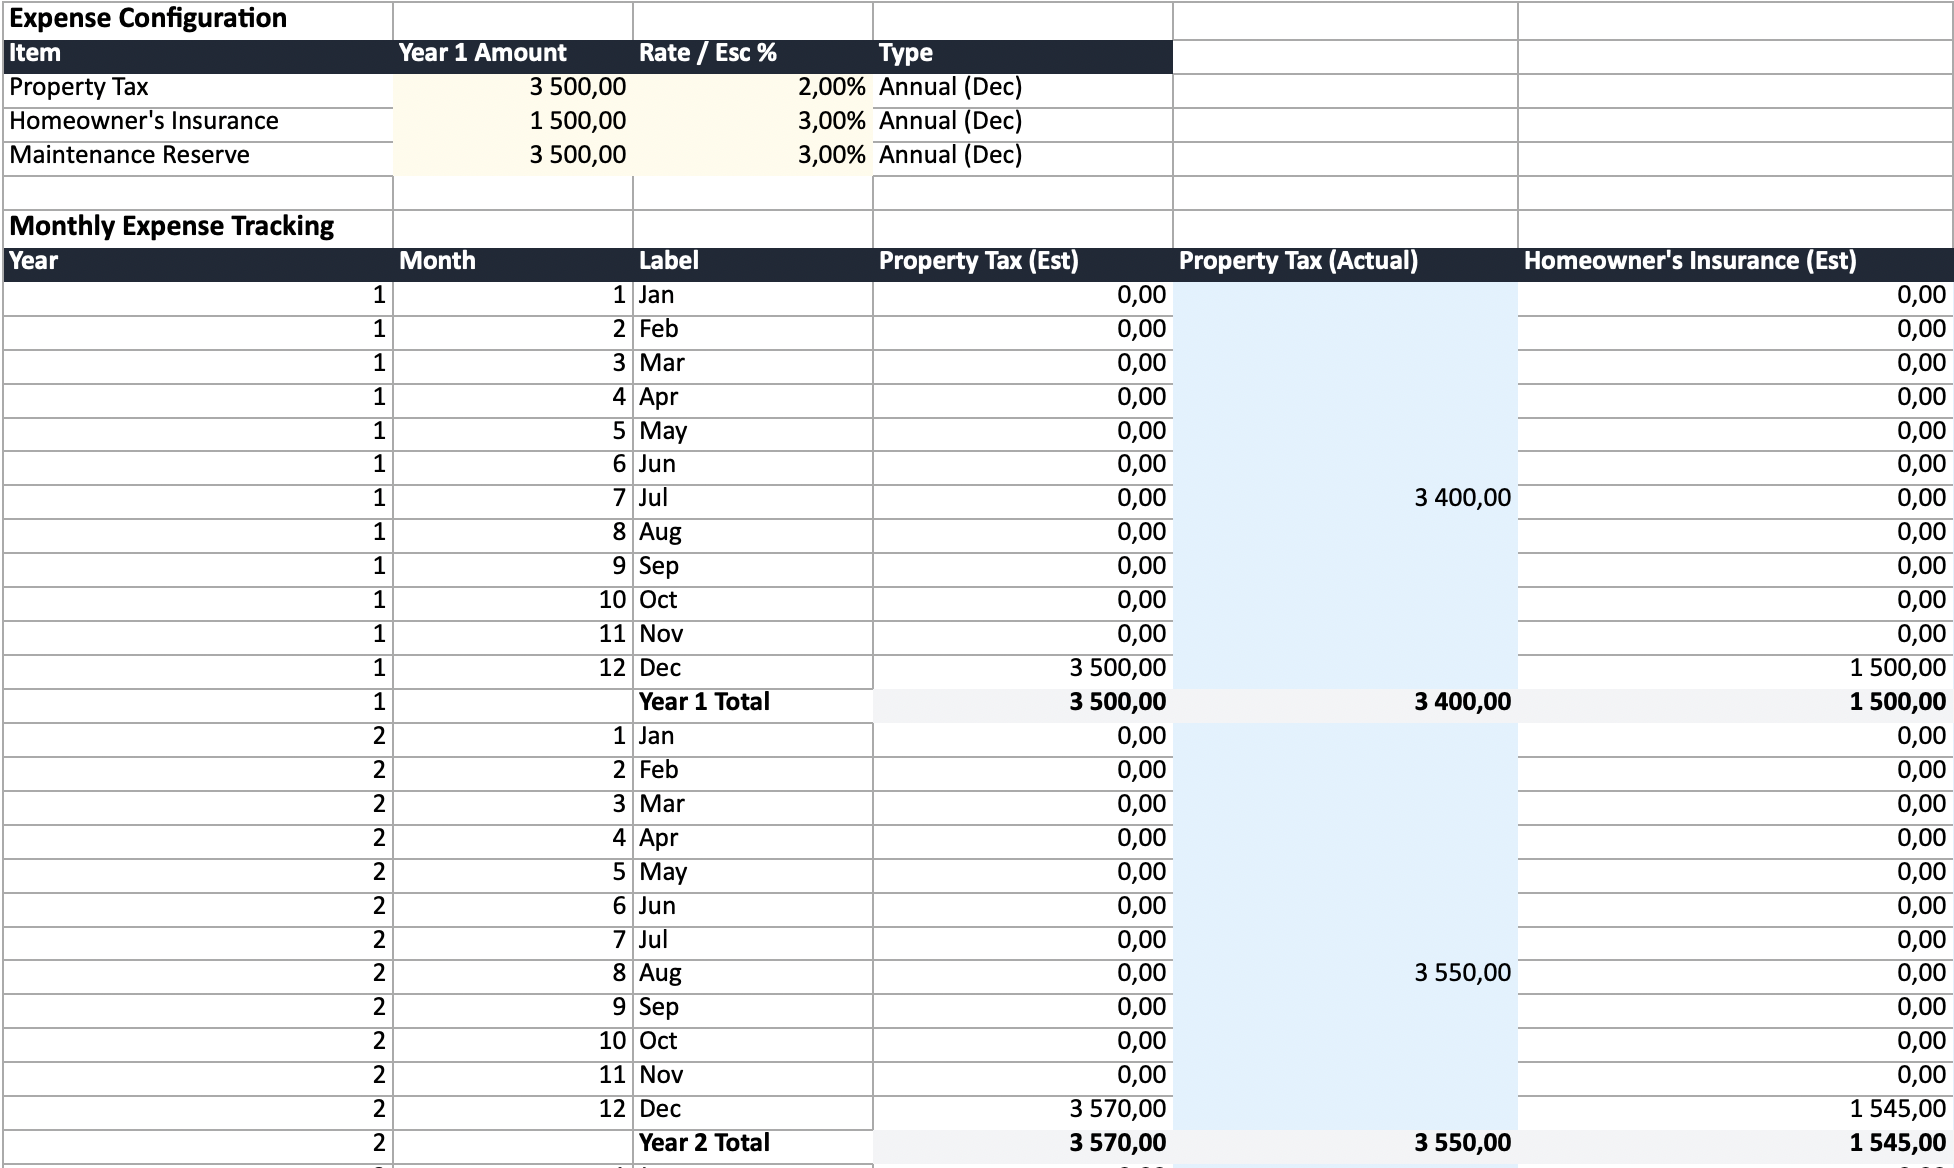
- Monthly rows for income and expenses (12 per year, with annual subtotals)
- Per-item expense columns with individual escalation rates
- Estimated values pre-populated, with blue cells for logging actuals
- Automatic blending — actual values where entered, estimates where not yet logged
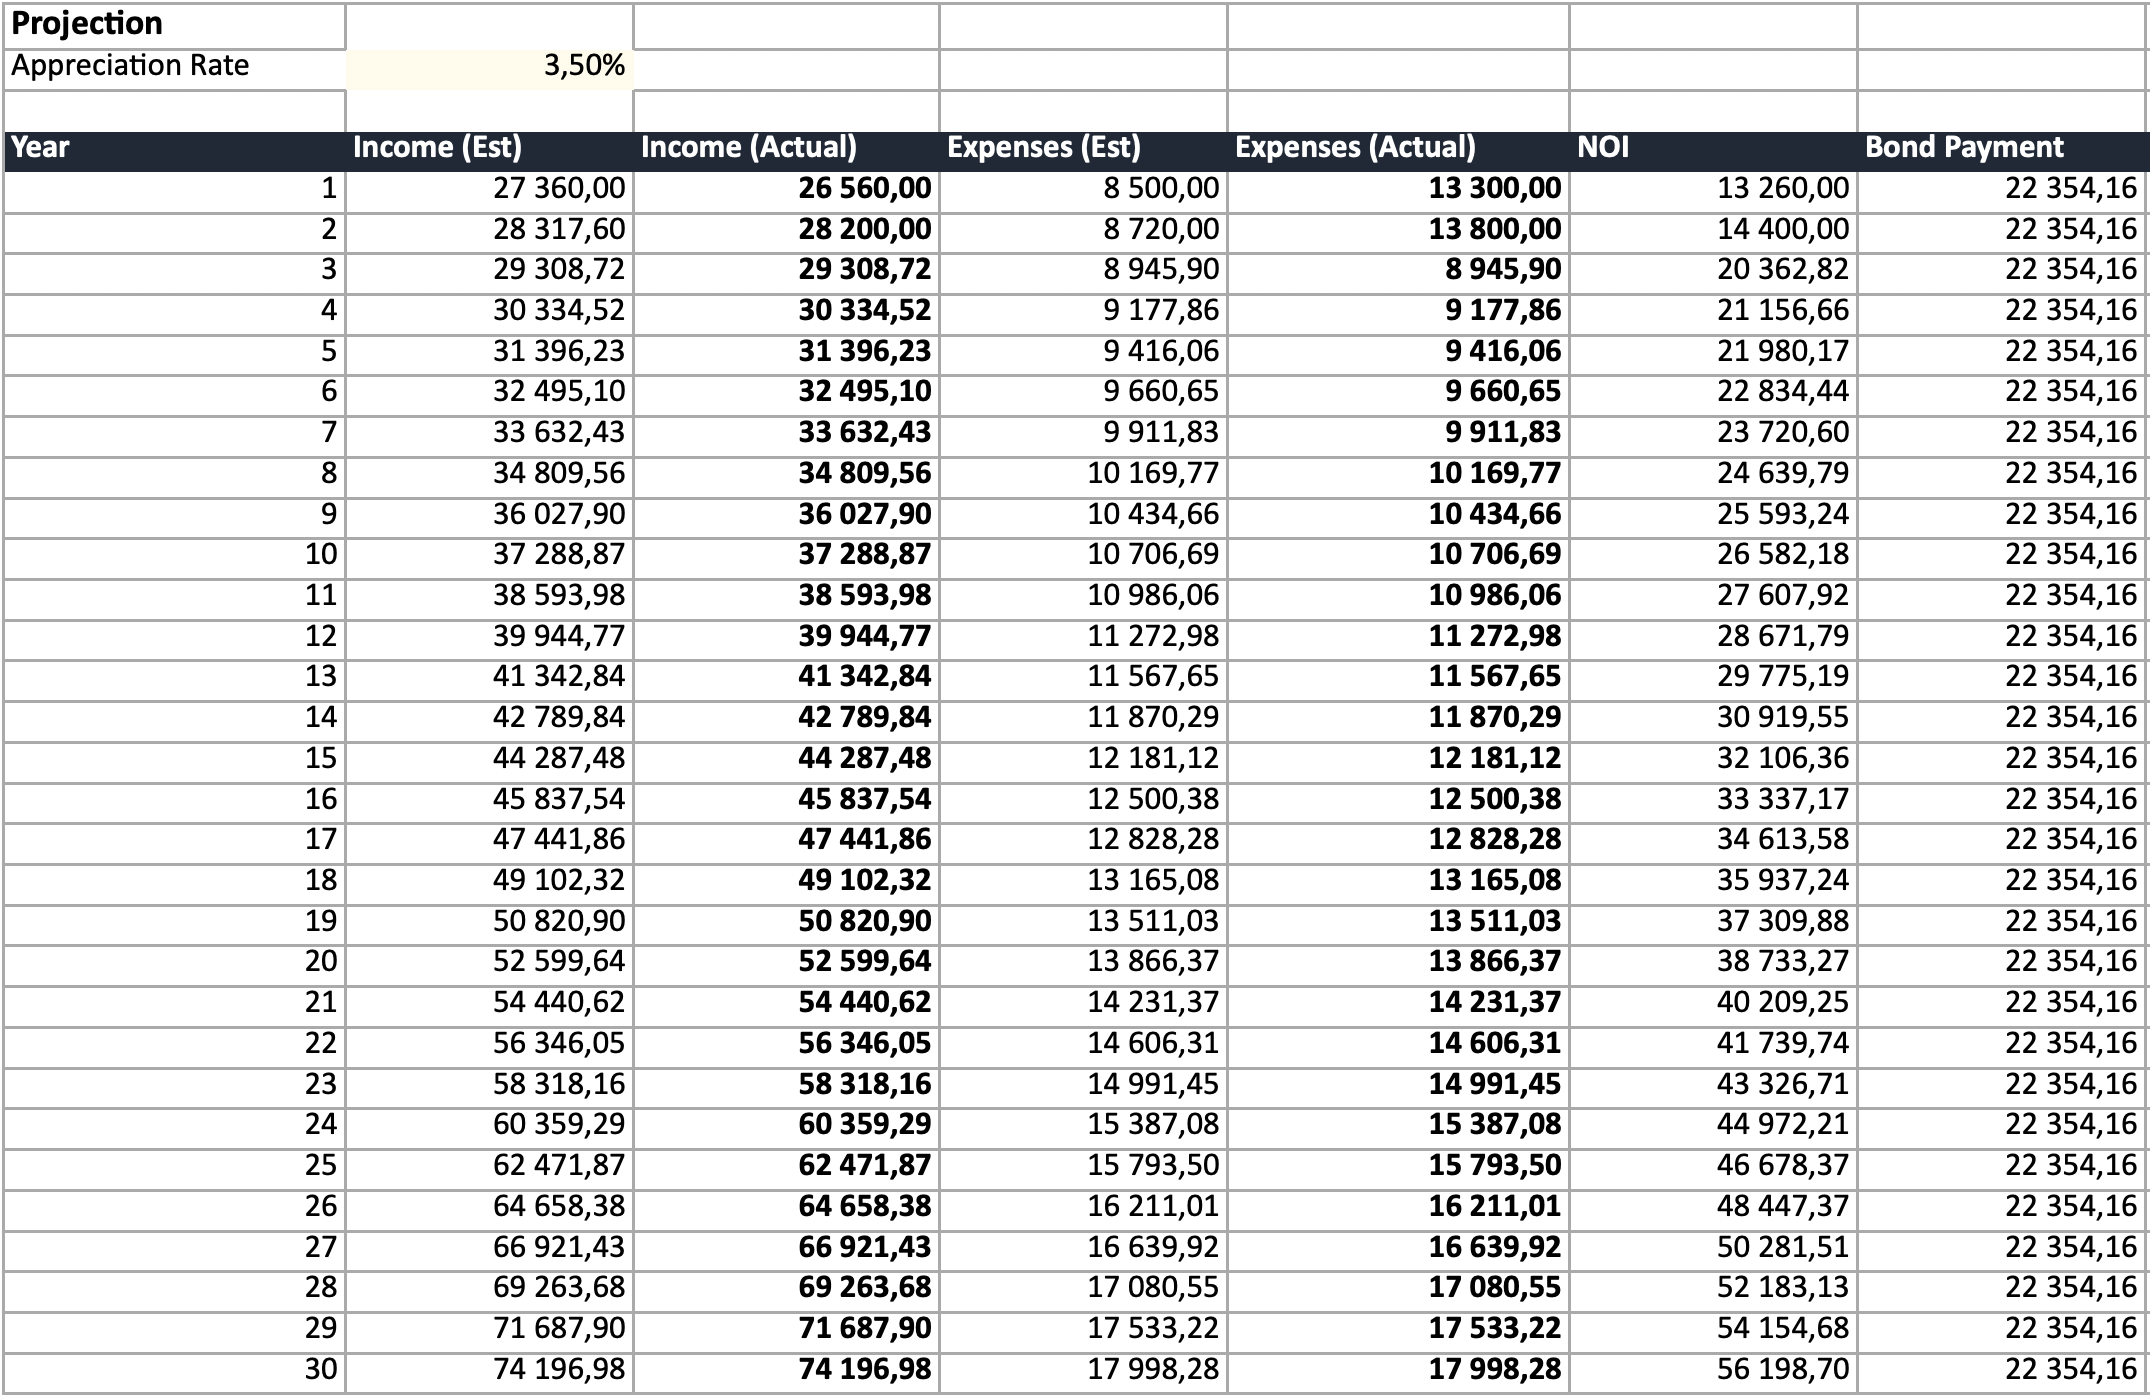
- Annual projection that pulls from your monthly data automatically
- Airbnb support — track nights booked, bookings, and per-night/per-booking costs, with occupancy, ADR, RevPAR, and break-even occupancy on the Summary
The spreadsheet arrives pre-populated from your calculation, so you start with a real baseline — not a blank template.
Try the spreadsheet generator and export →
Property management software
Tools like Stessa, Landlord Studio, or Baselane handle day-to-day income and expense logging with bank account integration and receipt scanning. They’re good for the operational side — but most don’t offer the projection comparison that shows whether your investment thesis is holding up.
A practical approach: use property management software for daily logging, export the data periodically, and compare it against your original projection spreadsheet.
The tool matters less than the habit
Pick something and use it consistently. A simple spreadsheet updated monthly beats sophisticated software that you abandon after three months. The value is in the comparison over time, not the tool itself.
Start with the right baseline
Good tracking starts with a good baseline analysis. If your initial projections were based on incorrect costs or unrealistic assumptions, the comparison is meaningless.
Run your property through the calculator with accurate, country-specific costs before you buy — then export to Excel and start tracking from day one. The gap between what you projected and what actually happens is where the real learning is.