Most property spreadsheets are empty templates. You download them, stare at a blank grid, and then spend an hour entering formulas that might be wrong. Or worse — you fill in numbers without knowing whether your expense assumptions are realistic for your country.
Our spreadsheet is different. You run a calculation on the site, then export it. The spreadsheet arrives pre-populated with your actual numbers — purchase costs, country-specific taxes, per-item expenses with individual escalation rates, and a full multi-year projection. All backed by live formulas.
How to get it
- Go to the spreadsheet generator — it auto-detects your country
- Enter your property details — purchase price, rent, expenses, financing
- Click Calculate to run the analysis
- Click Export to Excel in the results section
The spreadsheet downloads instantly. No signup, no email gate. Open it in Excel, Google Sheets, or LibreOffice.
What’s in the spreadsheet
The export generates a 7-sheet Excel workbook. Each sheet has a specific role — some are editable inputs, some are for tracking actuals, and one is entirely formula-driven.
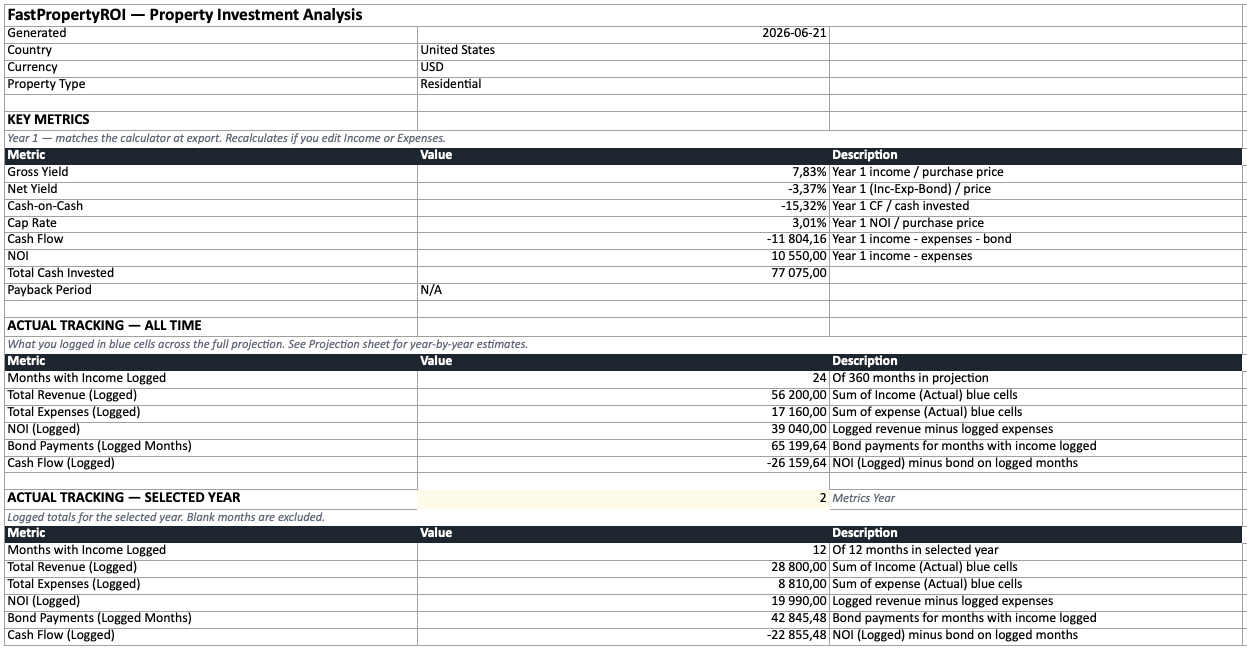
Summary
Your key metrics at a glance — gross yield, net yield, cash-on-cash return, cap rate, and payback period. All values are live formulas that reference the other sheets. Change a purchase cost or log actual income and the summary recalculates automatically. For Airbnb properties, the Summary also shows the standard short-term-rental KPIs — occupancy, ADR (average daily rate), RevPAR (revenue per available night), and break-even occupancy.
Purchase Costs
Every closing cost line item for your country — transfer tax, legal fees, registration, agent commission, deposit. All amounts are editable (yellow cells). The total feeds into your cash-on-cash return and payback period calculations on the Summary sheet.
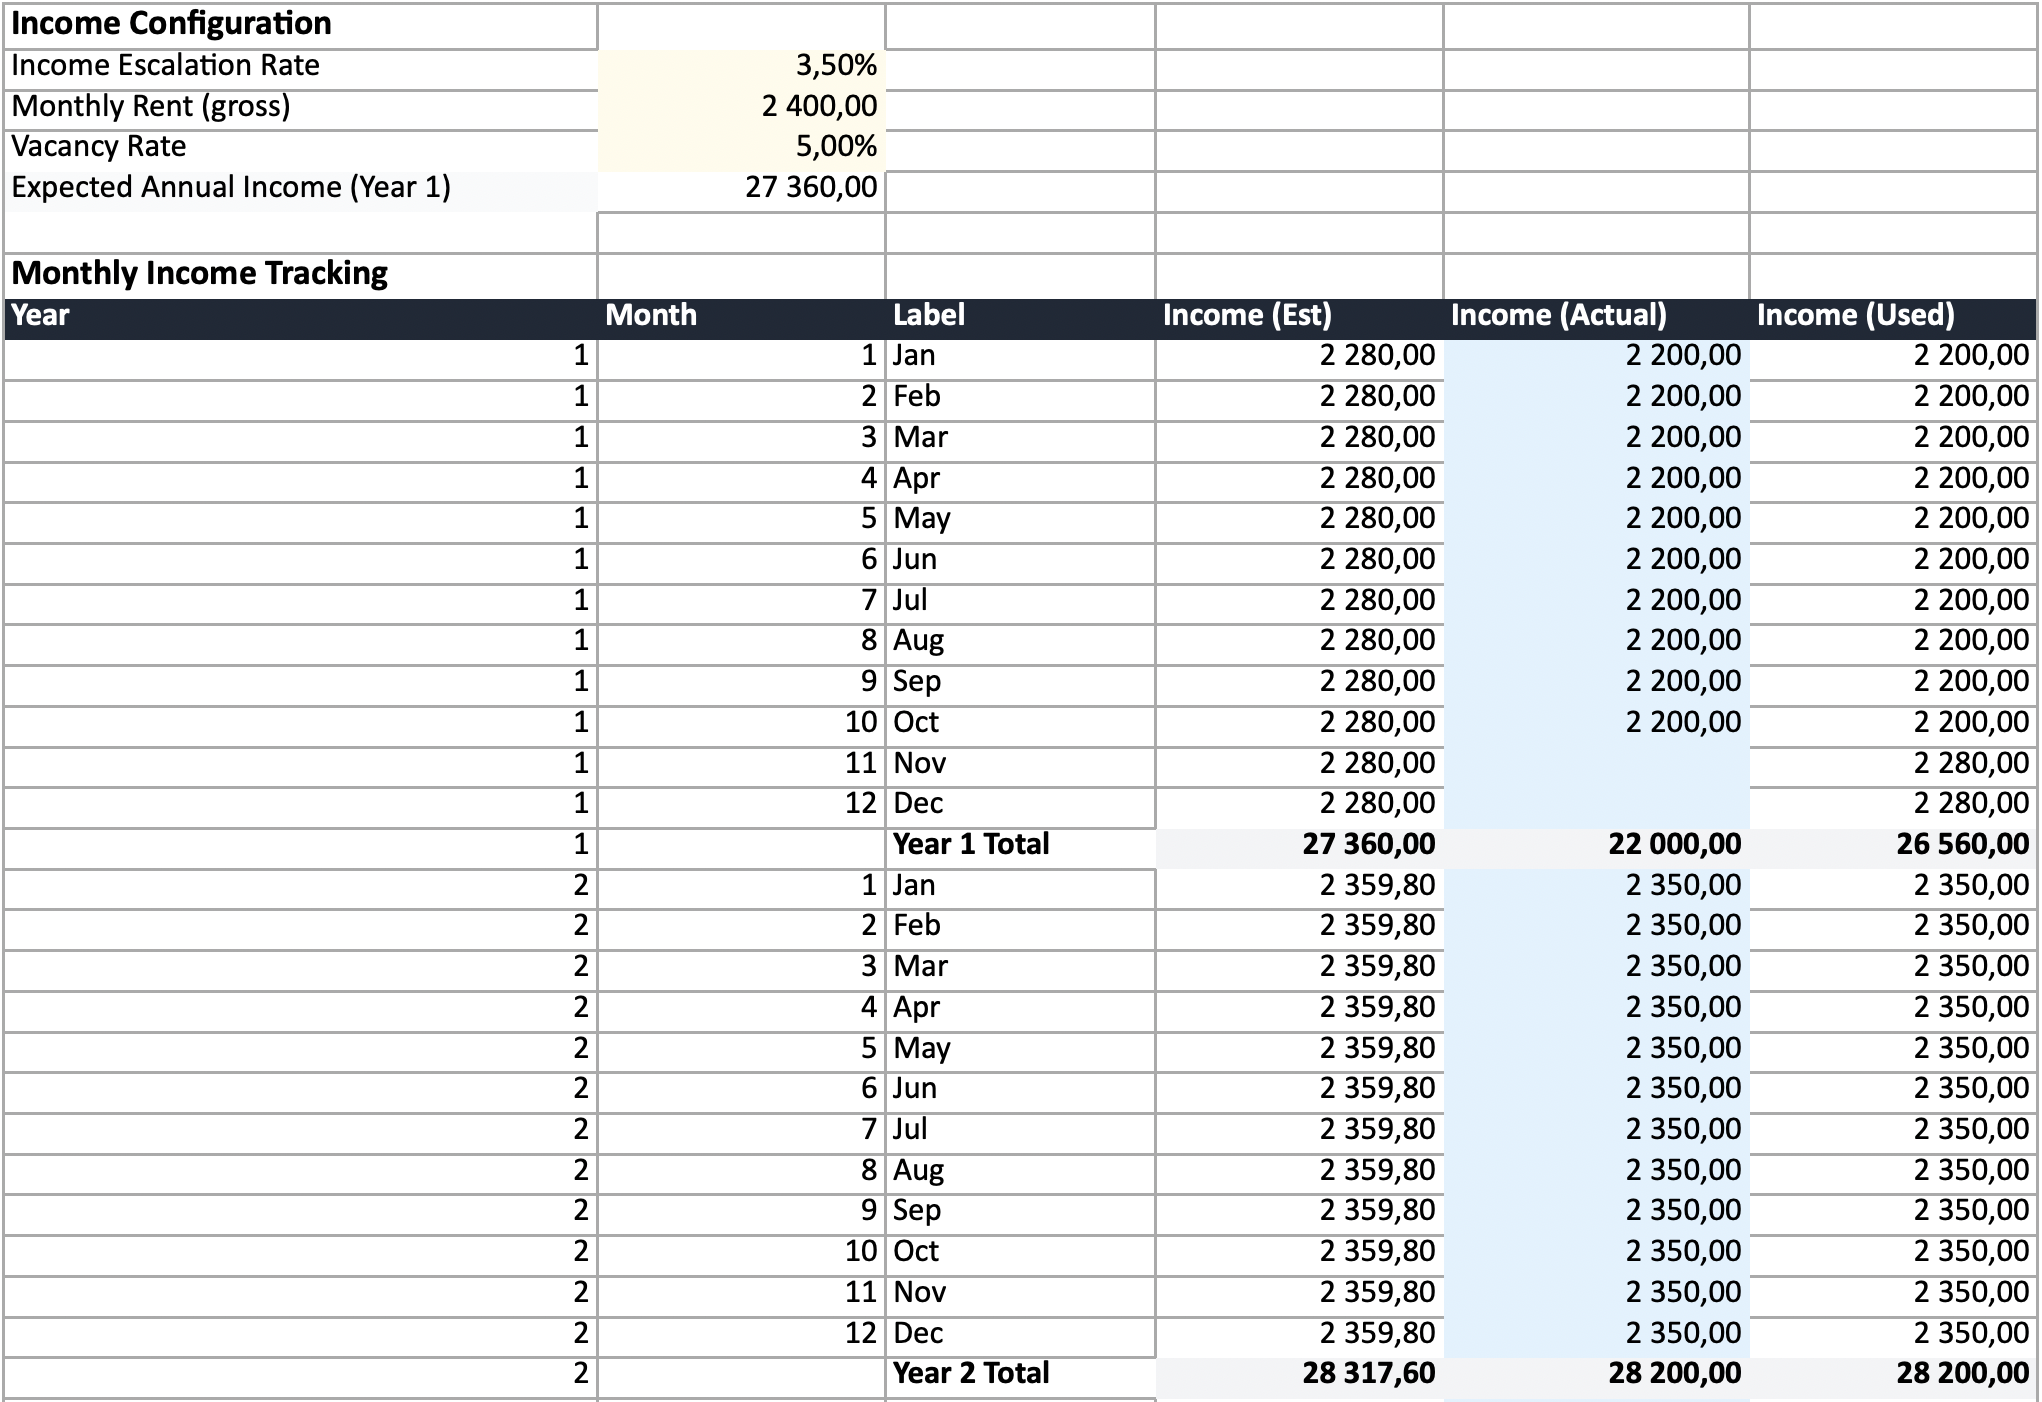
Income
Two sections in one sheet. At the top: editable configuration — monthly rent, escalation rate, and vacancy for long-term rentals. For Airbnb properties: nightly rate, occupancy percentage, and average stay length.
Below: a monthly tracking table with 12 rows per projection year plus an annual subtotal. Each month has an estimated income column (formula-driven from your config) and a blue “actual” cell where you log real rental receipts as they come in.
For Airbnb, the monthly table also includes nightly rate, nights booked, and bookings columns — so per-night and per-booking costs on the Expenses sheet can calculate from your actual usage.
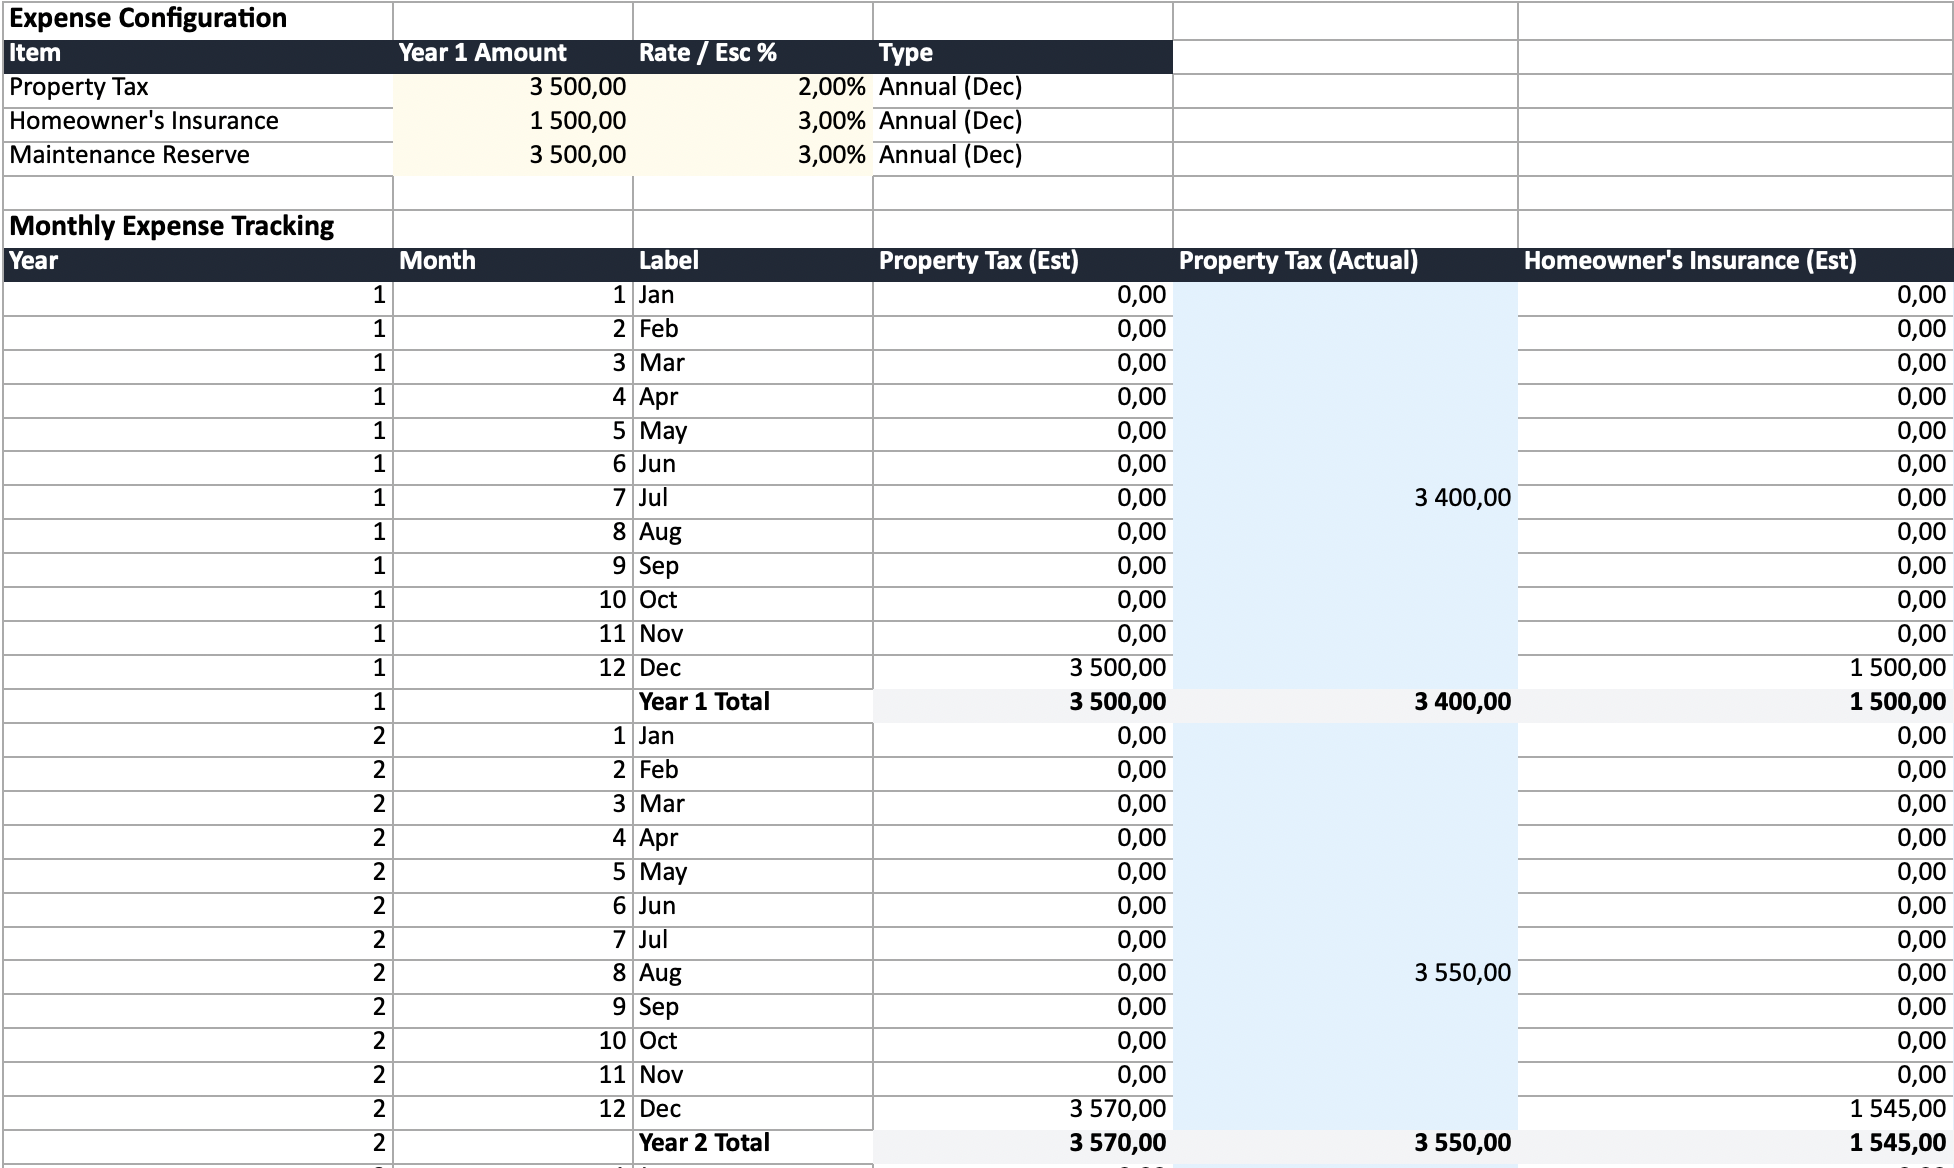
Expenses
This is where the per-item detail lives. At the top: each expense item on its own row with an editable base amount, escalation rate, and type label. Council Tax at 3% escalation, insurance at 4%, maintenance at 2% — each tracked independently.
Below: a monthly tracking table mirroring the Income sheet. Each expense item gets an estimated column (formula-driven from the config) and a blue “actual” column. Change an expense’s base amount or escalation rate in the config, and every month’s estimate updates.
For revenue-linked costs (management fees, platform fees), the estimates reference the Income sheet — so they scale with your actual income when you log it.
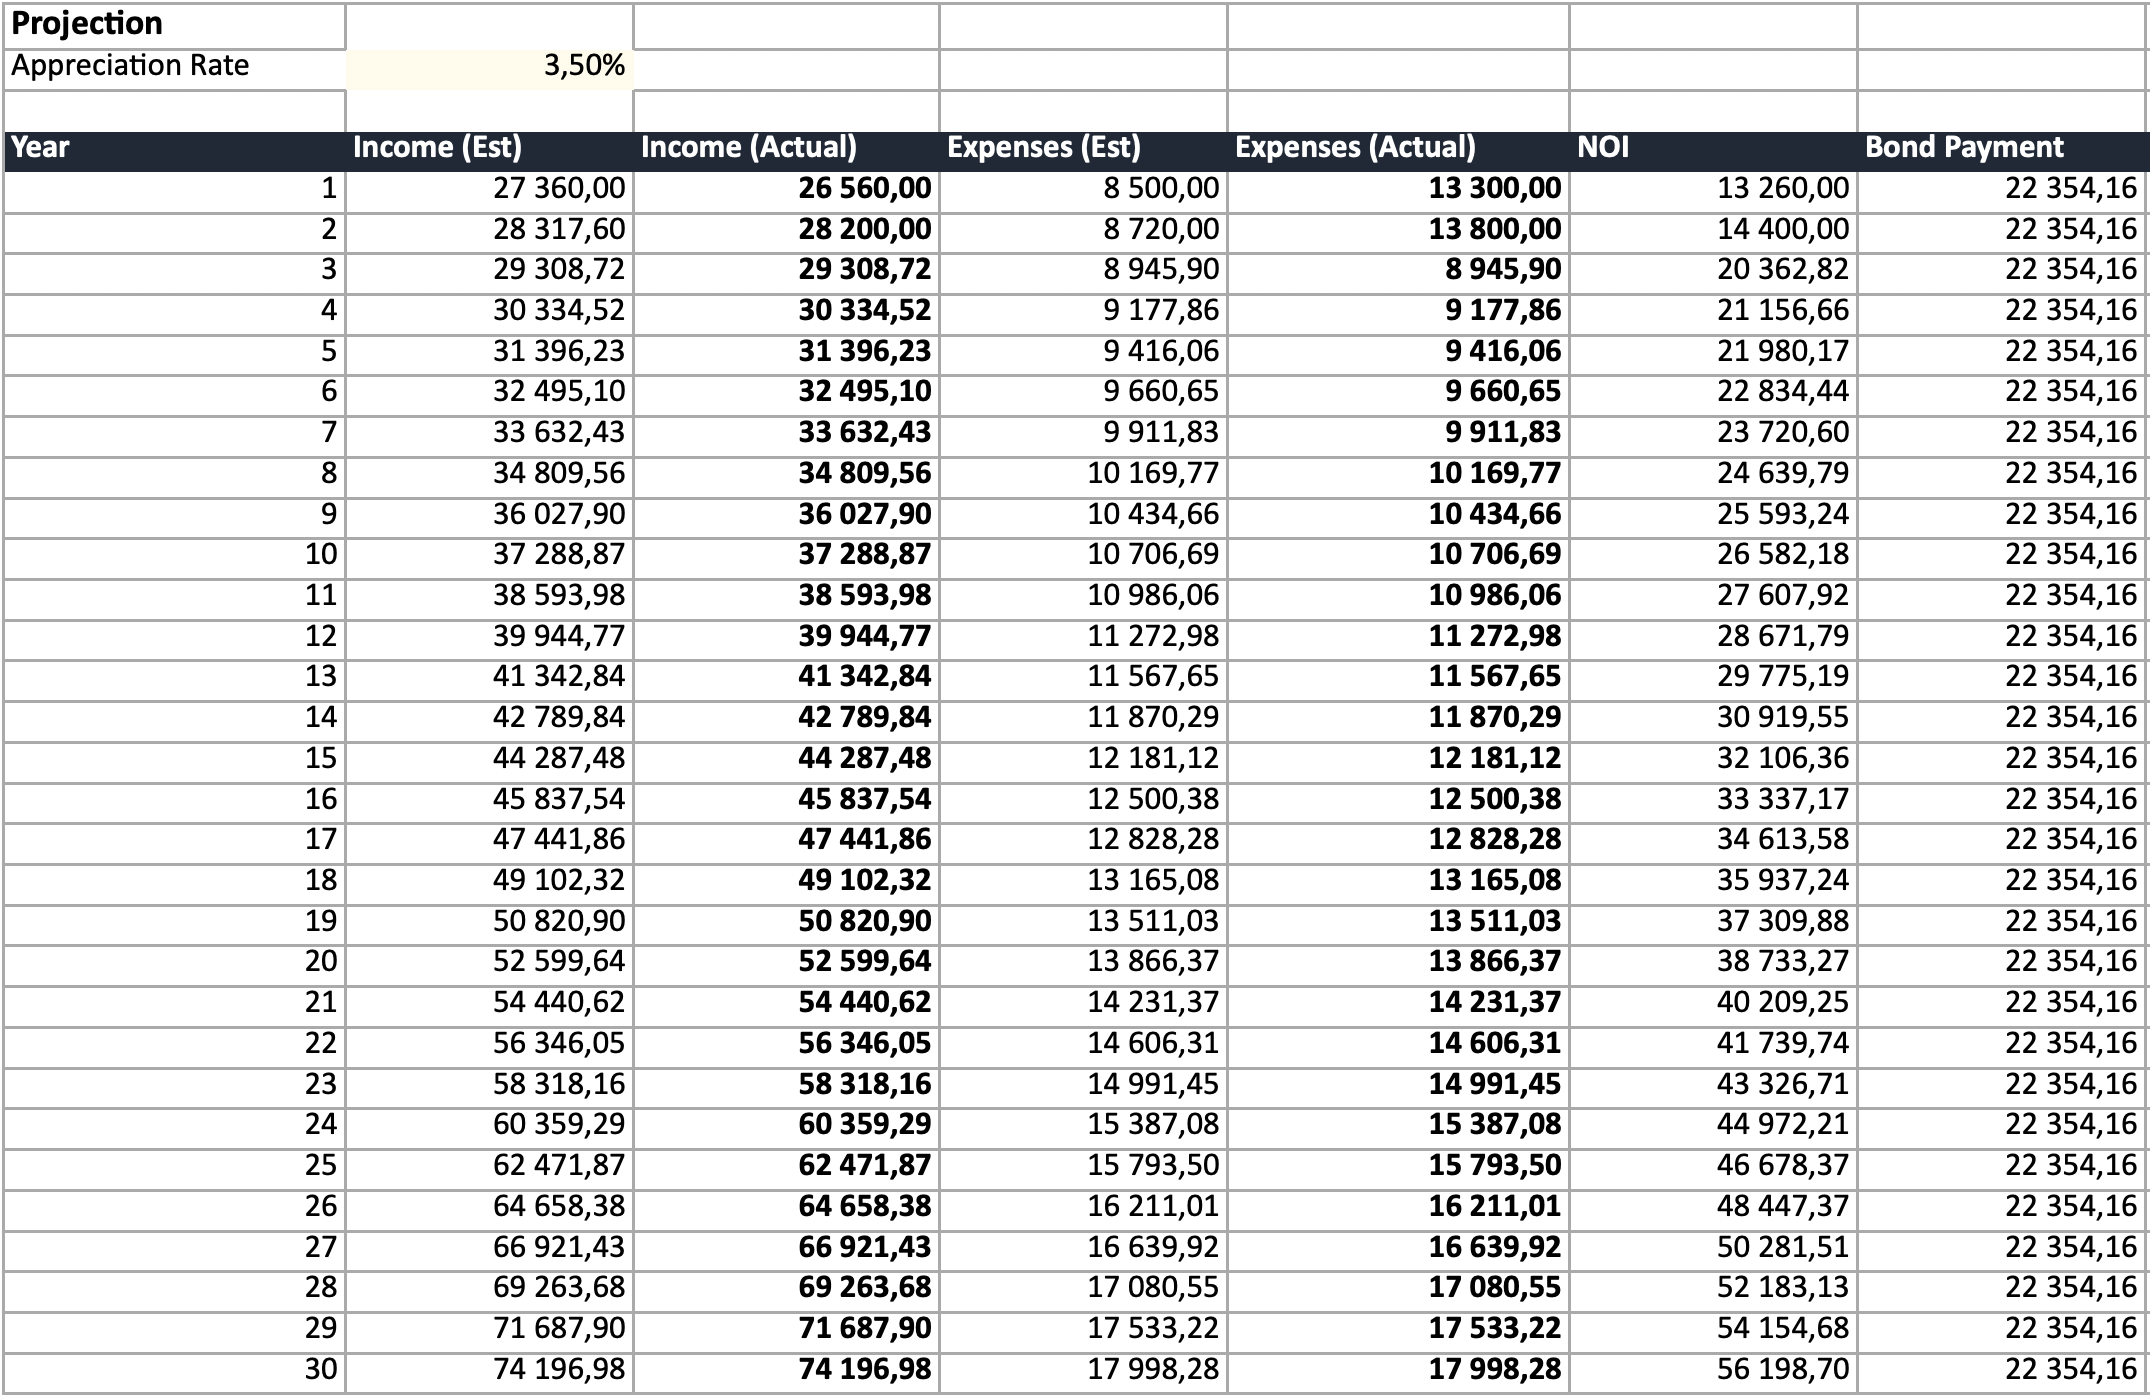
Projection
The annual overview — and the only sheet with no editable cells (except the appreciation rate). Every value is a formula pulling from the Income and Expenses sheet subtotals:
- Income (Est) and Income (Actual) — the actual column blends your logged actuals with estimates for months you haven’t filled in yet
- Expenses (Est) and Expenses (Actual) — same blending logic
- NOI, Cash Flow, Cumulative CF — all derived from the actual columns
- Property Value, Equity, CoC Return — live formulas using appreciation rate and purchase price
The exit scenario columns (exit costs, net proceeds if sold) show projected values from the original calculation.
Exit Scenario
Exit cost line items — agent commission, compliance costs, capital gains tax, bond payoff. Amounts are editable. Net proceeds is a formula (property value minus total exit costs).
Notes
Explains the colour code (yellow = editable, blue = actuals), what each sheet does, and which values are hardcoded.
What makes it different
Pre-populated, not blank. Every number comes from a real calculation using your property’s details and your country’s actual tax and fee structure. You don’t guess at transfer duty brackets or closing cost percentages.
Per-item escalation. Each expense has its own escalation rate. Council tax might escalate at 3%, insurance at 4%, and maintenance at 2%. The spreadsheet models this correctly instead of applying a single inflation rate to everything.
Actual tracking with fallback. The Projection sheet’s actual columns always show a value — actual where you’ve entered data, estimated where you haven’t. You don’t need to fill in every month for it to work. Enter one month’s actual rent and the rest stays estimated.
Airbnb-aware. Airbnb exports include nightly rate, occupancy, nights booked, and bookings as separate trackable columns, and surface the standard STR KPIs on the Summary — occupancy, ADR, RevPAR, and break-even occupancy. Per-night costs (tourism levies) and per-booking costs (cleaning) auto-calculate from your actual nights and bookings.
Country-specific. A South African export has municipal rates, levies, and transfer duty. An English one has Council Tax, SDLT, and EPC certificates. A Dubai export has DLD fees and service charges. The line items match what you’ll actually pay.
Everything connects. Edit a purchase cost → total cash invested updates → CoC return updates → Summary recalculates. Log actual income → Projection actuals update → NOI and cash flow update. It’s one connected model, not isolated sheets.
Using it to track a real property
The spreadsheet is designed to grow with you from purchase through ongoing ownership.
Before purchase: Export the calculation to review all costs in detail. Edit amounts if you have better estimates (e.g., a specific quote from your conveyancer). Share the spreadsheet with your financial advisor.
Month 1 onwards: Open the Income sheet at the end of each month. Enter your actual rent received in the blue cell. Do the same for expenses — enter actual property tax, insurance payments, maintenance costs as they occur. Takes about 5 minutes per month.
Quarterly or annually: Check the Projection sheet. Compare the Est and Actual columns. If actuals are consistently different from estimates, update the config section (escalation rates, base amounts) to improve future projections.
If you adjust assumptions: Change an escalation rate in the Expenses config → every future month’s estimate updates → Projection annual totals recalculate → Summary yields update. The whole model stays consistent.
Calculate your property
The spreadsheet is only as good as the calculation behind it. Start with accurate, country-specific numbers.
Go to the spreadsheet generator →
For a detailed breakdown of costs in your country, read the buying guides.