
Why STR tracking is different
Most hosts analyse an Airbnb carefully before buying — nightly rate, occupancy, the cleaning fee — then buy it and stop measuring. The assumptions you made (occupancy, average stay length, off-season rate) are educated guesses. Some will be right. Some won’t. If you’re not tracking actuals against your original projection, you won’t know which were wrong until it’s too late to adjust your pricing or your cost base.
A short-term rental also breaks the simple “rent received once a month” model a buy-to-let runs on. Revenue is nightly rate × occupied nights, cleaning is charged per booking, occupancy levies are charged per night, and platform fees are a percentage of revenue. Track only a monthly revenue total and you lose the ability to see whether a high cleaning bill is a pricing problem or just a run of short stays. (For the long-term-let version of this routine, see how to track rental property income and expenses.)
What to track
Income — three numbers, every month
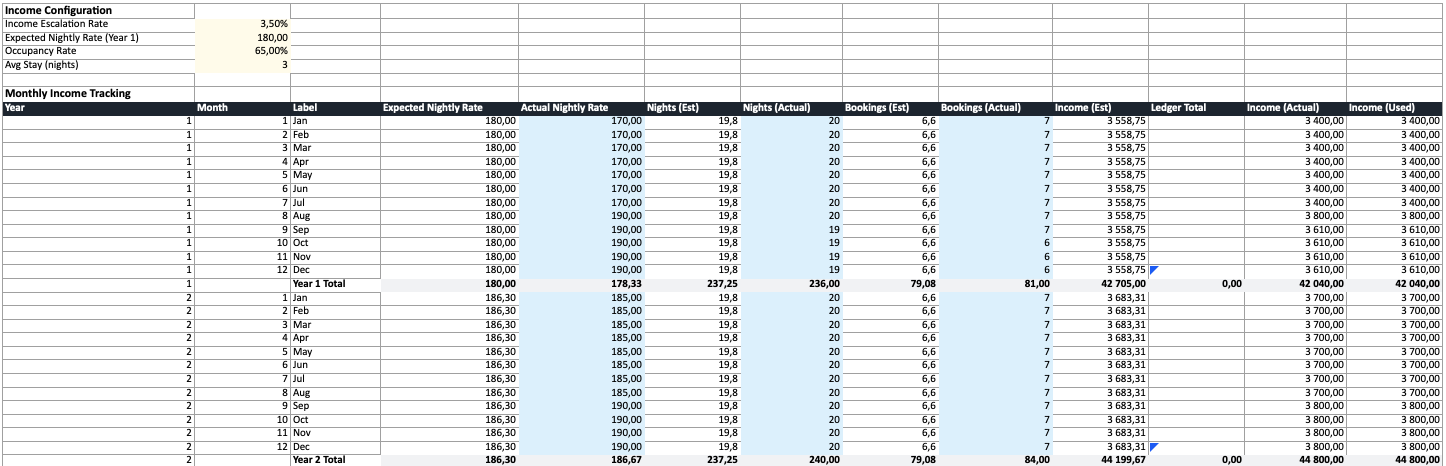
For a short-term rental, log three things per month:
- Nights booked — your actual occupancy.
- Number of bookings — separate stays, not just total nights. This is the number a generic income log throws away.
- Revenue — total received, before or after platform fees (just be consistent).
Nights and bookings matter because several costs are driven by them. Cleaning is per booking, tourism and occupancy levies are per night, and platform fees are a percentage of revenue. With all three logged you can also see the metrics that actually compare periods — occupancy, ADR (average daily rate), and RevPAR (revenue per available night).
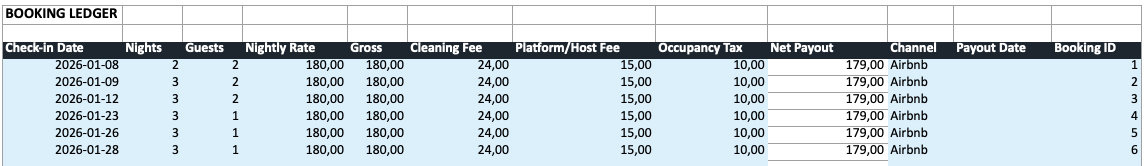
Prefer to log stays individually? The Booking Ledger lets you record each reservation — check-in, nights, payout — and rolls the totals up into the monthly income row automatically.
Expenses
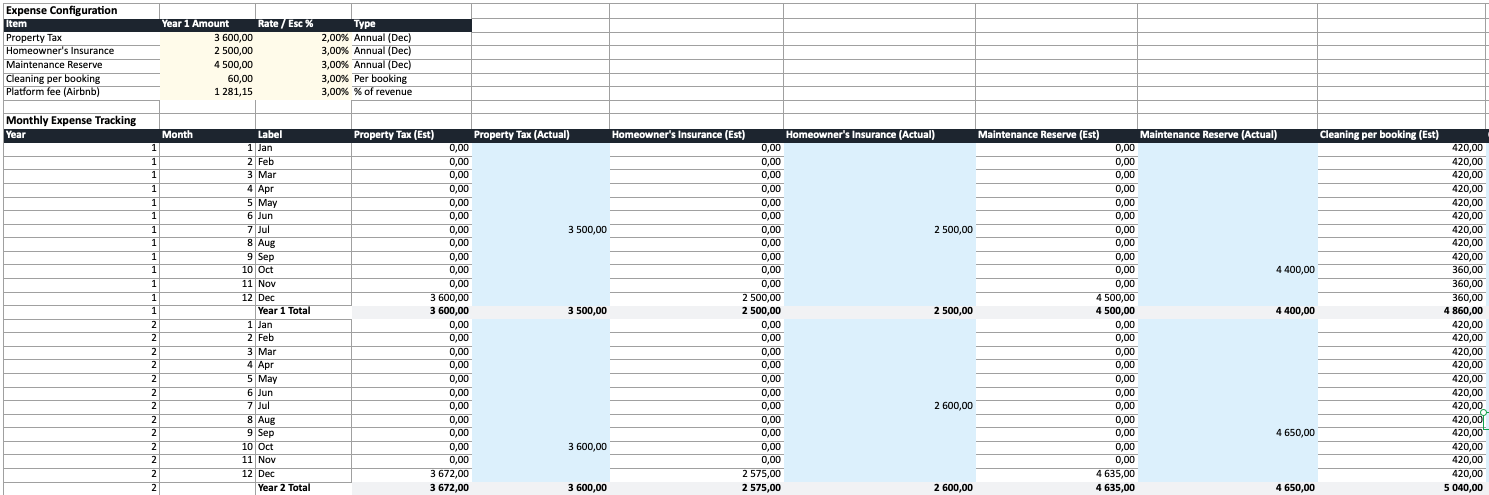
Track every recurring cost as it occurs, broken out by category — and note how each one scales:
| Category | What to log | Scales with |
|---|---|---|
| Cleaning / turnover | Cost per clean | Per booking |
| Platform / channel fees | Airbnb, VRBO, Booking.com fee | % of revenue |
| Occupancy / tourist tax | Levy collected per night | Per night (pass-through) |
| Supplies & consumables | Toiletries, coffee, linens | Roughly per booking |
| Utilities | Power, water, internet | Monthly |
| Insurance | STR / holiday-let cover | Annual |
| Maintenance | Each repair or service | As it happens |
| Management / co-host | Fee | % of revenue or flat |
Track each category separately. A single monthly total can’t tell you whether it’s your cleaning or your platform fees that are eating the margin — you need per-category visibility to act on it.
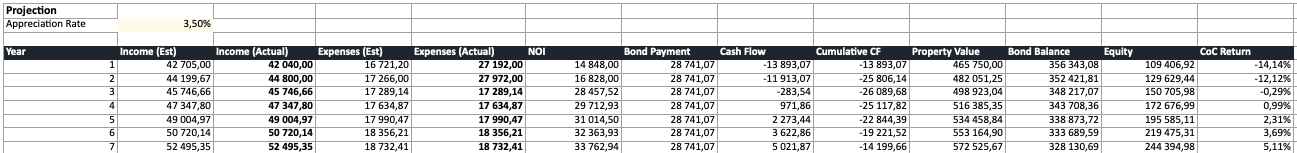
Property value
Check your property’s estimated market value once a year. You don’t need a formal valuation — comparable sales give a reasonable estimate. This feeds your equity position and your effective return if you sell.
How often to update
Monthly is the right cadence. You’re already getting payout statements from each platform — just log nights, bookings, and revenue, plus any expenses, at month end. Ten minutes is enough.
Annually, review the bigger picture:
- How did actual occupancy and ADR compare to projected?
- Are per-booking costs (cleaning, supplies) climbing faster than you assumed?
- Has the property value moved?
- Is the gap between estimated and actual widening or narrowing?
Estimated vs actual
The most useful comparison isn’t “how much did I earn?” — it’s “how much did I earn vs what I expected?”
When you first analyse an Airbnb, your calculator produces an estimated year based on assumptions: 65% occupancy, $180 ADR, a 3-night average stay. Those define your projected revenue and yield. Tracking actuals lets you see the gap:
| Year 1 Est | Year 1 Actual | Variance | |
|---|---|---|---|
| Occupancy | 65% | 58% | -7 pts (slower shoulder season) |
| ADR | $180 | $172 | -$8 (discounted to fill nights) |
| Room revenue | $42,705 | $36,400 | -$6,305 |
| Cleaning | $4,740 | $5,400 | +$660 (more short stays) |
| Net cash flow | $9,200 | $1,800 | -$7,400 |
That gap is invisible if you only track a monthly revenue total. Breaking it into occupancy, ADR, and per-booking costs tells you exactly what happened — here, you discounted the rate and filled with shorter stays, so revenue fell while cleaning rose. The fix (hold the rate, target longer bookings) is only visible because the booking count was logged.
Tax: what STR hosts can usually deduct
Short-term rental tax treatment varies by country, and STR income is often treated differently from long-term rent — sometimes as a trade rather than passive rental income. This is general guidance, not tax advice; check the specifics with an accountant in your country. That said, hosts can typically deduct:
- Platform and channel fees — Airbnb, VRBO, and Booking.com commissions.
- Cleaning and turnover costs — including supplies and consumables.
- Management or co-host fees.
- Utilities, internet, and subscriptions for the property (apportioned if you also use it personally).
- Insurance, maintenance, and repairs.
- Mortgage interest and depreciation — rules differ sharply by country, so confirm locally.
One thing to keep separate: occupancy or tourist taxes you collect from guests are a pass-through, not your income. You collect them and remit them, so they shouldn’t inflate your revenue or your tax base — track them on their own line. Good monthly records make this painless: when the categories are already split out, your annual return is a summing exercise, not an archaeology project.
Tools for tracking
Spreadsheet
A spreadsheet gives you full control. Our spreadsheet generator (or the short-term rental calculator) exports a ready-made Excel workbook built for STR tracking:
- Monthly rows with nightly rate, nights booked, and bookings columns
- Per-item expense rows with individual escalation rates, including per-night and per-booking costs
- Estimated values pre-populated, with blue cells for logging actuals
- Automatic blending — actuals where entered, estimates where not yet logged
- STR KPIs on the Summary — occupancy, ADR, RevPAR, and break-even occupancy
The spreadsheet arrives pre-populated from your calculation, so you start with a real baseline — not a blank template. See what’s inside the exported workbook or the free Airbnb / short-term rental spreadsheet template for the full breakdown.
Property management software
Tools like Hostaway, Guesty, or Stessa handle day-to-day logging with channel and payout sync. They’re good for the operational side — but most don’t compare performance against your original investment projection, the “is this Airbnb doing what I expected?” question. A practical setup: use PM software for daily logging and a projection spreadsheet for the yearly reality check (more on that trade-off in calculator vs spreadsheet).
The tool matters less than the habit
Pick something and use it consistently. A simple spreadsheet updated monthly beats sophisticated software you abandon after three months. The value is in the comparison over time, not the tool.
Start with the right baseline
Good tracking starts with a good baseline. If your initial projection used the wrong occupancy or ignored per-booking cleaning, the comparison is meaningless.
Run your Airbnb through the calculator with accurate, country-specific costs before you buy — then export to Excel and track from day one. The gap between what you projected and what actually happens is where the real learning is.